Project management metrics: Complete guide for PS teams (2026)

•
•
Summarize blog with






It's Thursday morning. The executive review is in two hours.
Five browser tabs are open: Salesforce, the capacity spreadsheet, the time tracking tool, the PM dashboard, and the financial forecast.
None of them shows the same utilization number.
The Salesforce forecast is $200K higher than the spreadsheet.
Three projects show green in the PM tool.
Finance is flagging budget overruns on two of them. The report you needed by Tuesday still isn't done. In 90 minutes, you're sitting in a room answering for the project management metrics you don't fully trust.
PS leaders spend 6 to 8 hours per week manually consolidating data from fragmented systems. By the time the report is ready, it is already out of date. This is not a discipline problem. It is a visibility infrastructure problem.
Project management metrics are quantifiable measures of project performance across schedule, cost, scope, quality, and resource utilization.
Professional services teams are the intelligence layer between delivery and business outcomes. Think margin, revenue recognition, and customer satisfaction — all connected, all visible before problems compound.
The distinction that matters most: leading indicators predict problems. Lagging indicators confirm them after damage is done. Most PS organizations track almost entirely lagging indicators. That is why weekly reviews feel reactive. That is why at-risk projects stay invisible until a client escalates.
Rocketlane is the agentic execution platform 750+ PS teams use to track project management metrics in real time. It holds a 94% G2 recommendation rate and a $60M Series C from Insight Partners (March 2026).
Revenue more than doubled year-over-year. Rocketlane marks the shift from merely tracking work to actively executing it. No batch processing — real-time data flows from time entry to portfolio dashboard without a manual export.
This guide covers the 15 project management metrics that matter in PS delivery. It includes formulas, benchmarks, and how to calculate each one.
It also shows how high-performing PS teams replace the 8-hour Thursday reporting sprint with real-time operational intelligence.
What are project management metrics?
Project management metrics are quantifiable measures used to evaluate a project's performance, progress, and efficiency across multiple dimensions, including schedule, cost, scope, quality, and resource utilization.
Project performance metrics and project metrics are essential for monitoring and evaluating project progress throughout the project lifecycle.
Tracking key performance indicators (KPIs) and project KPIs helps measure performance and ensure alignment with project objectives.
In professional services, project management metrics serve as the operational intelligence layer that connects day-to-day delivery activities to business outcomes such as margin, revenue recognition, and customer satisfaction.
The word “metrics” is often used interchangeably with “reports” and “dashboards,” but the three are not the same. Metrics are the specific measurements.
Reports are how those measurements get presented. Dashboards are how teams monitor them in flight. Getting the underlying metric definitions right is the foundation for everything else.
Generic project management frameworks were not built for professional services. Schedule variance, cost variance, and defect density come from software engineering and construction.
PS teams need a framework that accounts for billable versus non-billable time, utilization targets, margin protection, and client-facing delivery quality together. Borrowing metrics from another discipline without adapting them is one of the most common reasons PS dashboards miss the point.
Tracking project progress using relevant metrics enables teams to identify issues early and make data-driven decisions.
The most important classification for PS leaders is not financial versus operational. It is leading indicators (which predict problems) versus lagging indicators (which confirm problems that have already occurred).
Most PS organizations track mostly lagging indicators, which is why their weekly reviews feel reactive. Proactive governance requires leading indicators at the center of every weekly review.
What are metrics in project management vs. KPIs?
Metrics are quantifiable measurements of specific project activities or outputs: hours tracked, tasks completed, and budget consumed. KPIs (Key Performance Indicators) are a subset of metrics directly tied to strategic business objectives.
Every KPI is a metric, but not every metric is a KPI. For PS teams, KPIs typically include billable utilization, project margin, time to value, and on-time delivery rate.
Tracking key performance indicators (KPIs) enables teams to manage projects more effectively by aligning efforts with organizational goals and ensuring that project management metrics support data-driven decision-making.
What types of project management metrics do PS teams need to track?
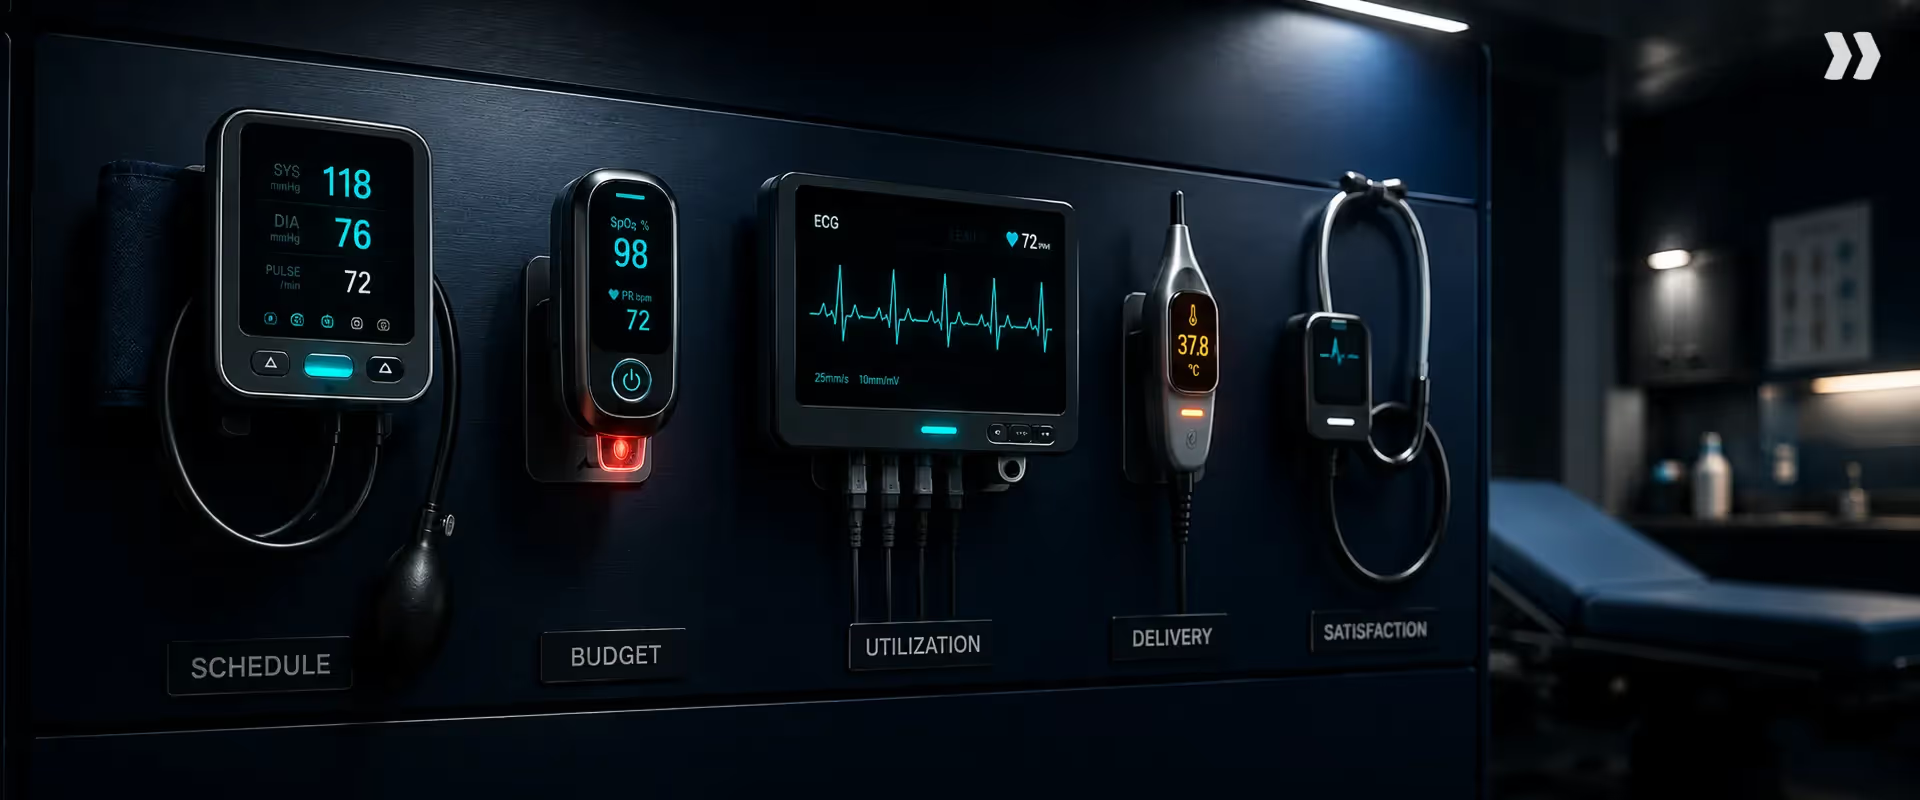
Most metrics frameworks list 30 to 50 indicators and leave PS leaders to figure out which ones matter most. In professional services, five categories cover 90% of what drives delivery success and margin protection.
Selecting appropriate project management metrics is crucial, as it ensures that project management efforts are focused on measurable goals that align with organizational objectives and enable effective monitoring and evaluation of project performance.
Financial metrics
Financial metrics measure the economic performance of projects by tracking revenue, costs, margins, budget consumption, and profitability at the project, portfolio, and service-line levels. In professional services, financial metrics are the ultimate arbiter of delivery success: a project can be delivered on time and still be unprofitable if costs are not actively managed.
Actual cost performance is evaluated by comparing actual costs to the approved and planned budgets, providing insights into cost efficiency and helping determine whether the project is over or under budget.
Core examples: Margin, budget vs. actual, burn rate, revenue recognition, CPI.
Resource and utilization metrics
Resource metrics measure how effectively team capacity is being deployed across billable and non-billable work.
Utilization (the percentage of available time spent on billable projects) is the primary resource metric for most PS organizations, but capacity planning, bench time, and allocation accuracy are equally important for sustainable delivery.
Maintaining the recommended resource utilization rate of 70% to 90% for production-level staff is a critical success factor, ensuring both sustainable delivery and optimal team performance.
Core examples: Billable utilization, total utilization, capacity vs. demand, bench time, allocation accuracy.
Delivery health and schedule metrics
Delivery health metrics measure whether projects are progressing as planned, tracking milestone completion, schedule variance, task overdue rates, and overall project RAG status.
Comparing actual progress against the planned schedule and monitoring project schedules helps identify negative schedule variance, which signals that a project is behind schedule. These are the metrics that surface at-risk projects before they escalate.
Core examples: Schedule variance (SV), on-time delivery rate, RAG status, milestone completion rate, overdue task count.
Earned value metrics
Earned value metrics connect schedule performance to financial performance, measuring how much value has been delivered relative to what was planned and what it cost.
EVM metrics (EV, PV, SPI, CPI, EAC) constitute the most rigorous framework for measuring project performance and are essential for fixed-fee and complex multi-phase engagements.
Earned value management supports project execution and project control by integrating scope, schedule, and cost data, enabling teams to identify issues such as overspending or milestone delays early and take corrective action to keep the project on track.
Core examples: Earned value (EV), planned value (PV), SPI, CPI, estimate at completion (EAC).
Customer success metrics
Customer success metrics measure the quality and impact of delivery from the client’s perspective, tracking satisfaction, time to value, and engagement through the delivery lifecycle.
Customer satisfaction score (CSAT) and customer satisfaction index are key metrics for measuring client satisfaction with project outcomes and deliverables, often collected through surveys or interviews.
The Net Promoter Score (NPS) is another important metric for evaluating customer loyalty, asking how likely clients are to recommend the product or service.
High customer satisfaction ratings are closely linked to successful project delivery and positive project outcomes, indicating that projects meet deadlines, stay within budget, and meet client expectations. For PS teams, CSAT and time to value (TTV) are leading indicators of renewal, expansion, and referral revenue.
Core examples: CSAT, NPS, time to value (TTV), time to go-live, client engagement rate.
What are the 15 essential project management metrics for professional services?
Not all metrics deserve equal attention. These 15 project management metrics directly impact profitability, delivery consistency, resource planning, and long-term growth in professional services organizations.
Financial metrics
1. Billable Utilization Rate
What it is: The percentage of a consultant’s available working time spent on billable client work that directly generates revenue.
Target: 65–75%
PS note: This metric is often miscalculated because billable hours and total available hours are usually pulled from different systems.
2. Project Margin
What it is: The percentage of profit earned on a project after subtracting all project delivery costs from the total revenue.
Target: 25–40% gross margin
PS note: Calculating margin only after project completion is reactive. Tracking project margin in real time helps teams identify cost overruns early and protect profitability.
3. Budget Variance (BV)
What it is: Budget variance measures the difference between the planned project budget and the actual project cost.
PS note: A project being under budget does not always mean success. If the project is delayed or missing milestones, it can still create delivery risks.
4. Revenue Forecast Accuracy
What it is: A metric that measures how closely forecasted revenue matches the actual revenue recognized during a specific period.
Target: ±10% for the current quarter
5. Non-Billable Time Percentage
What it is: The percentage of employee time spent on internal or administrative work that cannot be charged to clients.
Target: Below 20–25%
PS note: If non-billable time exceeds 30%, it may indicate operational inefficiencies, excessive internal work, or unmanaged scope creep.
Resource metrics
6. Capacity vs. Demand Ratio
What it is: This metric compares available employee capacity with the projected workload required for upcoming projects.
PS note: This metric works effectively only when customer relationship management (CRM) pipeline data is integrated with resource planning systems.
7. Planned vs. Actual Allocation Variance
What it is: The difference between the number of hours originally planned for a project and the actual hours used during execution.
PS note: Consistent positive variance across similar projects may indicate inaccurate pricing or underestimation during planning.
8. Bench Time Rate
What it is: The percentage of employee capacity that remains unassigned or unallocated to active projects.
Target: Below 10–15%
PS note: Bench time above 20% may indicate weak pipeline management or an imbalance in staffing and skill allocation.
Delivery health metrics
9. On-Time Delivery Rate
What it is: The percentage of projects completed on or before the committed delivery deadline.
Target: Above 80%
PS note: A low on-time delivery rate usually points to estimation issues, planning gaps, or execution delays.
10. Time to Value (TTV)
What it is: Time to Value (TTV) measures how long it takes for a customer to experience the first measurable benefit after the project begins.
PS note: Reducing TTV is a strong indicator of delivery efficiency and customer success maturity.
11. Project Health Score (RAG Status)
What it is: A project tracking indicator that uses Red, Amber, and Green (RAG) statuses to show overall project health based on budget, schedule, risks, and milestone progress.
PS note: RAG status is most effective when generated automatically using live project data rather than manual updates from project managers.
12. Milestone Completion Rate
What it is: The percentage of project milestones completed on or before their planned deadlines.
PS note: Missed milestones are often one of the earliest warning signs of project delays or delivery risks.
Earned value metrics
13. Schedule Performance Index (SPI)
What it is: The Schedule Performance Index (SPI) measures whether project work is progressing as planned.
Interpretation:
- SPI < 1.0 = Project is behind schedule
- SPI > 1.0 = Project is ahead of schedule
PS note: An SPI below 0.85 on fixed-fee projects is usually an early warning sign that requires immediate attention.
14. Cost Performance Index (CPI)
What it is: The Cost Performance Index (CPI) measures how efficiently project costs are being used compared to the value delivered.
Interpretation: CPI < 1.0 = Project spending is higher than the value delivered
PS note: Review CPI together with SPI. A healthy schedule with poor cost efficiency may still damage project profitability.
15. Estimate at Completion (EAC)
What it is: Estimate at Completion (EAC) predicts the total expected project cost based on current project spending trends and cost efficiency.
PS note: For fixed-fee projects, EAC should be reviewed weekly. If the EAC exceeds the contract value, profit loss is no longer a risk; it is already happening.
A team running half of these project management metrics well, in real time, from a single source, will outperform a team running all 15 from disconnected systems.
The discipline is not in the count. It is in the consolidation, the cadence, and the speed of action when a metric crosses a threshold.
Project management KPIs vs. metrics: What's the difference?

Project management metrics are all quantifiable measurements of project activity and performance. Project management KPIs are a subset of metrics that directly reflect progress toward strategic business objectives.
The distinction matters in practice: a PM might track 30 metrics to manage a project, but a VP of PS reports 5-7 KPIs to the executive team.
The filtering principle: a metric becomes a KPI when it is tied to a business outcome with a defined target. KPIs should be aligned with key business objectives and project goals to ensure that measurement is meaningful and supports desired outcomes.
“Hours logged” is a metric. “Billable utilization above 70%” is a KPI. This distinction is what separates an operational dashboard from an executive scorecard. The PM needs detail; the leadership team needs signal.
What are the key KPIs in project management for PS teams?
The key KPIs in project management for professional services teams are: billable utilization rate, project margin, on-time delivery rate, time to value, budget variance, CSAT score, and forecast accuracy.
These seven indicators cover financial performance, delivery quality, and customer success, the three dimensions that determine whether a PS organization is scaling sustainably or merely growing.
What to avoid: Tracking too many KPIs at the executive level. More than 7-9 KPIs in a leadership review creates noise. Leaders stop engaging with the dashboard and start asking for the "real" numbers informally.
How do you choose the right metrics for your PS team?
.avif)
Most PS organizations try to fix metrics by adding more of them. The right approach reverses that: narrow the list, secure the foundation, then expand.
This 5-step framework is how high-performing PS teams build a metrics practice that scales.
- Start with the three questions leadership asks most often: What are the current utilization and margin numbers? How are projects tracking against plan? What risks need attention this week? The metrics that answer these three questions are your minimum viable set. Everything else is secondary until these are reliable, real-time, and trusted.
- Identify where your biggest margin leakage is occurring: Common patterns: resource cost misalignment, scope creep without change orders, non-billable absorption, and delayed invoicing. The metrics you need most urgently are the ones that expose your specific leakage patterns. Not a generic list of 47 KPIs.
- Choose leading indicators alongside lagging ones: For every lagging metric in your dashboard, add one leading indicator that predicts the same outcome. Planned-vs.-actual allocation variance predicts margin erosion. SPI trend predicts schedule slip. Non-billable time rate predicts efficiency degradation.
- Define metrics consistently before tracking them: "billable utilization" means different things across organizations. Before tracking it, define what counts as available hours and what counts as billable. Inconsistent definitions are the primary reason PS leaders “can’t trust the data.”
- Start with five core metrics, expand quarterly: Implement billable utilization, project margin, budget vs. actual, on-time delivery rate, and TTV first. When these are accurate and trusted, add the next layer. Selecting and tracking the right metrics helps improve and optimize project performance, ultimately achieving project success. Metrics maturity is a journey, not a one-time implementation.
The temptation is to pick five favorite metrics and skip the rest. The discipline is in deciding why each metric is on the list before it goes on the dashboard. That is the difference between a metrics practice and a metrics habit.
What are earned value metrics in project management?
Earned value management (EVM) is a project management methodology that integrates scope, schedule, and cost measurements to provide an objective assessment of project performance.
For professional services teams, EVM metrics are the most rigorous framework for tracking whether project work is being delivered at the planned cost and pace.
What makes EVM rigorous is its refusal to treat scope, schedule, and cost as separate conversations. A project on schedule but over budget is performing poorly.
A project on budget but behind schedule is also performing poorly. EVM forces both questions to be answered together.
The four core EVM metrics explained
- Planned Value (PV): The budgeted cost of work scheduled to be completed by a specific point in time. It represents what you planned to spend and accomplish, the baseline against which actual performance is measured.
- Earned Value (EV): The budgeted cost of completed work. It answers the question: how much of the budget should we have consumed based on what we have delivered?
- Schedule Performance Index (SPI) = EV ÷ PV: SPI of 1.0 means delivering exactly as planned. A value below 1.0 indicates less work completed than scheduled. For PS teams on fixed-fee projects, an SPI trending below 0.85 is an early warning signal that requires an immediate review of resources or scope.
- Cost Performance Index (CPI) = EV ÷ AC: CPI of 1.0 means consuming costs exactly as planned relative to work delivered. Below 1.0 means spending more than the value delivered justifies, directly signaling margin erosion.
Estimate at completion (EAC): The most forward-looking EVM metric
EAC matters most for PS leaders because it converts the current CPI into a projected total cost. It answers the question "what will this project cost in the end?" before the project is over. Formula: EAC = BAC ÷ CPI. Recalculate weekly on every active fixed-fee project.
When EAC exceeds the contract value, you have a confirmed margin issue, not a projection.
What are PMO metrics, and what does portfolio-level visibility look like?

A PM managing one project needs project-level metrics. A PMO Director managing 15 PMs across 80 concurrent projects needs portfolio-level metrics. These differ fundamentally in what they measure, how they aggregate, and what decisions they enable.
The shift is not bigger numbers. It is a different category of question. Project portfolio management metrics answer the question, “How is the services organization doing?” Project-level metrics answer “how is this project doing?”
Leadership wants one screen. It shows which projects are healthy, which are at risk, and the aggregate financial picture. All of it, updated in real time.
The five portfolio-level metrics that matter most:
- The RAG aggregation problem: Most PS organizations have project-level RAG status. Few have automated a portfolio-level RAG that rolls up from real data without requiring each PM to self-report. Self-reported status is systematically optimistic. Data-driven status is reliable.
- Leading vs. lagging at the portfolio level: The most important leading indicators are three trends. The SPI trend across the portfolio predicts next quarter's schedule performance. CPI trend predicts margin performance next quarter. The capacity-to-demand ratio predicts revenue risk from resource shortage or bench cost from surplus.
The “cockpit view” is not a luxury. It shows every consultant, every assignment, every forecast, and every project that needs attention. For a PS organization with 50+ concurrent engagements, this separates proactive governance from permanent firefighting.
Effective use of PMO metrics at the portfolio level directly contributes to project management success by enabling proactive governance and risk management.
Why do project management metrics break down at scale?
Most PS metric problems exist not because teams cannot calculate them. The data lives in five or more disconnected systems, and nobody owns the consolidation.
Without consolidating project data from multiple systems, accurate and timely metric reporting becomes nearly impossible. PS leaders describe the result in plain terms: flying blind.
- The 24-system problem: PS leaders describe operating across 24+ disconnected tools for a single workflow. The list often includes Salesforce, NetSuite, OpenAir, Smartsheet, Jira, Confluence, Harvest, and Timely. Metrics exist in fragments across all of these. Nobody gets the complete picture without manual aggregation.
- The “outdated immediately upon submission” problem: Reports compiled manually from multiple systems are historical documents by the time they are presented. A project can swing from amber to red in a week. Week-old data is not governance. It is archaeology.
- The self-reported status problem: When project health data depends on PMs manually updating status, it inherits human bias. PMs have every incentive to report amber when they mean red. Automated health scoring works from real data: hours burned, milestones hit, budget consumed. That is structurally more accurate than any self-report system. The PMO sees real risk, not curated risk.
- The fractionalization problem: Consultants working across 10-15 projects simultaneously cannot be meaningfully tracked in the spreadsheet mess. Utilization calculations become estimations. Allocation data becomes aspirational rather than actual. Resource managers know the data is wrong, but cannot replace it with anything better.
The consequence. Leadership gets a Thursday morning report compiled from data accurate on Tuesday. It took 8 hours to build.
The finance system immediately shows different numbers. Leaders cannot confidently provide the executive team with what they need, and at-risk projects remain buried. This is the Where’s Waldo problem at scale.
Across PS organizations, the pattern is the same: data exists, but margin leakage gets detected only after the fact. The problem is not what to track. It is about seeing it in time to act.
Every mistake in this list shares a root cause. Metrics are being treated as a reporting output rather than a delivery management input. A Thursday report assembled from last week's exports cannot guide a Wednesday decision.
The PS organizations with the strongest margin performance and the lowest escalation rates do this differently. Their metrics arrive in real time, calculated automatically, and surfaced to the right person at the right moment.
See what a real-time PS metrics dashboard looks like. Download the free template.
What are the best practices for project management metrics?

Building a metrics practice is not a one-time setup. These seven habits move PS teams from reactive reporting to proactive governance, and they compound over time.
- Define every metric before you track it: Create a metrics glossary that defines how each KPI is calculated, its data sources, and its owner. Distribute it before the first dashboard goes live. Without this, two regions calculate billable utilization differently, and leadership loses confidence in the data entirely.
- Separate project-level from portfolio-level metrics: PMs review project-level metrics weekly. PMO leadership reviews portfolio-level metrics at a higher level of abstraction and at a different cadence. Without this, leadership reviews 80 project dashboards individually, and at-risk projects get missed.
- Automate health scoring: Configure project health to calculate automatically from delivery data. Remove the ability for PMs to manually override status without a documented reason. Without this, every PM reports green until escalation is unavoidable.
- Track leading indicators alongside lagging indicators: For every lagging metric in your weekly review, add one leading indicator that predicts the next period. If you can only name the lagging version of a metric, you are missing the governance layer.
- Connect metrics to the people who can act on them: PMs receive alerts when their project’s SPI drops below 0.85. Resource managers receive notifications when utilization drops below the threshold. Executives receive weekly summaries, not raw data to interpret. Without this, the right data reaches the wrong person, or reaches the right person too late.
- Use historical metric data to improve future estimates: At every project close, compare planned vs. actual metrics across phases, roles, and project types. Feed this into the estimation for similar future projects. Without this, teams estimate with the same optimism bias indefinitely.
- Review metric quality, not only metric values: Each month, audit whether metrics are being populated correctly. Are timesheets submitted on time? Are milestones marked complete as achieved, not retroactively? Without this, dashboards look healthy because the data is incomplete, not because delivery is healthy.
- Track quality metrics to maintain standards: Quality metrics measure project deliverables against predefined standards, assessing the number of defects or rework required. Monitoring these metrics helps ensure that deliverables meet customer expectations and maintain consistent quality.
Project management metrics benchmarks: What good looks like in professional services
PMI’s Pulse of the Profession research (pmi.org) finds that organizations with mature project management practices waste 28 times less money than those with low maturity.
Benchmarks give PS leaders something most internal data does not: external validation. They turn "this looks like a problem" into "this is 15 points below industry standard." That framing is what makes investment cases land with CFOs and CEOs.
Ranges represent healthy PS organizations. Use them as directional targets, not rigid standards. Healthy ranges vary by organization size, billing model, and service type.
Three patterns matter when working with these benchmarks. Warning signals are not failures; they are early triggers for review. Two metrics together tell a better story than one. SPI and CPI together reveal whether a project is on time, on budget, or both. The action trigger is a forcing function, not a verdict.
The utilization nuance. A team running at 85%+ utilization consistently is not necessarily high-performing. It is at risk of burnout, has no buffer for unplanned work, and is likely quietly absorbing scope creep. Sustainable utilization is the goal, not maximum utilization.
The question is not whether your utilization is above 70%. It is whether your utilization above 70% is translating into the margin you expected. High utilization with low margin means the team is busy but not profitable. That is a different problem requiring a different intervention.
Organizations with the most reliable metrics enforce data-entry policies at the point of submission. The mechanism is system-level governance, not training and trust.
When the system prevents a non-compliant time entry from being submitted, the data quality problem solves itself. When accuracy depends on every individual doing the right thing every time, it does not scale.
How does Rocketlane make PS metrics real-time and actionable?

The infrastructure problem has a structural answer. Rocketlane is the agentic execution platform for customer-facing professional services teams, the shift from merely tracking work to actively executing it. It does not add another layer of metrics on top of fragmented systems.
It becomes the single source of truth across project delivery, time, resources, and financials, with no batch processing; real-time data flows into every dashboard.
When the data lives in one place and is calculated automatically, metrics stop being a weekly assembly job. They become a live management surface.
Real-time portfolio dashboard: The cockpit view
PMO Directors describe wanting a "global cockpit." One screen where they can see every project, every consultant, every risk signal, without opening 80 records or waiting for Thursday's report.
Rocketlane provides executive and PMO dashboards with aggregate portfolio metrics.
These include total backlog, revenue forecast, revenue at risk, utilization by team and region, and at-risk project count. All of it updates in real time as work happens.
Filter by service line, geography, client segment, or project type. Drill from portfolio to project to phase to task in a single click.
Outcome: Leadership answers "how are we doing?" in 30 seconds. That question currently takes 8 hours to answer.
Automated project health scoring: No more self-reported status
Self-reported RAG status is systematically optimistic. By the time a project shows red on the dashboard, the margin damage is already done.
Rocketlane calculates project health automatically from actual delivery data. Inputs include budget consumption rate vs. scope completion, SPI, overdue milestone count, and CSAT score.
RAG status updates as the data changes, not as PMs choose to update it. Automated alerts fire when projects cross risk thresholds.
Outcome: Leadership sees which projects need attention before the PM escalates. The "Where's Waldo" problem is solved by the system.
Utilization and capacity reporting in real time
Most PS organizations know their utilization last month. Almost no one knows their utilization right now, or what it is projected to be in 6 weeks when three pipeline deals close.
Rocketlane provides live utilization reports by individual, team, region, and organization, showing a breakdown of billable and non-billable activity. A heat map shows, at a glance, from underutilized (yellow) to overallocated (red). Capacity vs. demand forecasting pulls pipeline data from Salesforce or HubSpot. It projects resource needs by role, week by week.
Outcome: Resource decisions are made with full visibility into capacity, not gut feel or a spreadsheet from last Friday.
Financial metrics connected to delivery data
In most PS organizations, financial metrics are a lagging indicator reported by the accounting system. Delivery metrics are a separate view in the PM tool. Nobody sees both together until the month-end closes.
In Rocketlane, every project's financial tab shows real-time margin, budget consumption, CPI, EAC, and revenue recognition.
The numbers update as time is tracked and milestones are completed. Portfolio financial reports show profitability by service line, region, and client segment without manual data assembly.
Outcome: Margin is a daily management metric, not a monthly surprise.
Custom metrics and formula fields
Formula fields let operations leaders build custom metrics using any data point in the system. No SQL knowledge or developer support required. Scheduled reports are delivered automatically to executive stakeholders via email.
Outcome: the metrics framework adapts to the business, not the other way around.
Customer proof: Hapi Cloud hit 85% billable utilization. Fluxx achieved 83% utilization. Teams using Rocketlane's operations insights report eliminate days of manual report compilation per week.
See Rocketlane's real-time PS metrics dashboard in action. Book a 20-minute walkthrough!
How does Rocketlane compare to other PSA and PM tools? (with G2 ratings)
Use the table below to compare Rocketlane against the most common PSA and project management platforms that PS leaders evaluate. G2 ratings are sourced from publicly listed G2 product profiles.
Decision routing: which tool fits which PS scenario?
Pick the tool that matches your PS organization's operating model, not the headline feature list.
What to know before you buy Rocketlane
Four objections PS leaders raise most often when evaluating Rocketlane, and what to test against in your evaluation.
How does Rocketlane Nitro transform project management metrics?
Real-time dashboards show what is happening. Nitro answers why, predicts what comes next, and enforces the data quality behind every metric.
How does AI change project management metrics for PS teams?
AI changes project management metrics by making them conversational, predictive, and self-enforcing. Instead of building reports to answer a question, delivery leaders ask the question in plain language and get an instant, structured answer from live data.
Instead of discovering data quality problems at month-end, AI governance enforces data entry policies at the point of submission. Instead of tracking what happened, AI surfaces what is likely to happen, weeks before it does.
AI Analyst: Natural language access to every metric
- The problem it solves: An operations leader needs to answer the question: "Which projects have a CPI below 0.85 and are also in the red on CSAT?" Today, that means exporting data from three systems, manually joining the data, and filtering in Excel. That process takes half a day. The answer is needed in 10 minutes.
- What it does: Ask in plain language. "Show me all projects where the margin at completion is projected below 20%." Or "What is our average TTV trend for enterprise implementations over the last two quarters?" Get a structured, real-time answer with drill-down capability.
- Real scenario: A VP of PS needs a profitability summary by service line for the current quarter. She needs a variance explanation before a board meeting. She asks the AI Analyst. The answer arrives in 90 seconds, is exportable, and is built from live data. The 4-hour Friday sprint is gone.
- Outcome: Metrics intelligence is democratized. The answers that once lived with one analyst are now accessible to every leader. All it takes is knowing how to ask a question.
Timesheet Policy Agent: Metrics quality at the point of entry
- The problem it solves: Metrics are only as reliable as the data feeding them. Non-billable hours logged against billable codes. Time submitted for completed tasks. Missing project codes. All of these corrupt utilization, margin, and CPI calculations at the source.
- What it does: Enforces data quality rules at the moment of time submission, in plain language. Block time entries against completed phases. Flag hours exceeding task estimates without a change order. Alert when the weekly submission is below the minimum billable threshold.
- Real scenario: A consultant logs time against a project phase that closed two weeks ago. The policy agent blocks the submission immediately and routes it to the PM for reclassification. The error never enters the utilization calculation, never affects the invoice, and never corrupts the metrics leadership will review.
- Outcome: Data quality is solved at the source, not discovered in the report.
Signals Agent: Predictive risk detection before it shows up in metrics
- The problem it solves: By the time a project shows red in the health dashboard, multiple lagging metrics have already turned negative. The better intervention is earlier. Risk signals appear in client conversations and delivery activity before they manifest in the numbers.
- What it does: Monitors client calls and emails for risk indicators. Examples: a client deprioritizing the project, a stakeholder change, budget freeze language, repeated complaints about pace. Surface these as early warning signals to the PM before the SPI drops.
- Real scenario: In a client call, the sponsor mentions their internal champion is moving to a new role. The Signals Agent flags this as a relationship risk and potential delivery delay. The PM can proactively restructure the project timeline before the inevitable slip.
- Outcome: Risk governance moves upstream, from the metrics dashboard (lagging) to the conversation layer (leading). Problems are caught 2-3 weeks earlier.
What are common project management metrics mistakes, and how do you fix them?
Most PS organizations fix the tool problem before they fix the data definition problem. The result: a shiny new dashboard built on the same inconsistent data that made the old dashboard untrustworthy. Avoid these seven mistakes.
1. Implementing dashboards before defining metrics
Mistake: Building the dashboard before the team agrees on what each metric means.
Fix: Spend one sprint on a metrics definition document before touching the tool. Each metric needs an owner, a formula, a data source, and a target before it goes on a screen.
2. Tracking metrics nobody uses
Mistake: Adding every available metric just to feel thorough.
Fix: Start with the five questions leadership asks every week. Identify the metrics that answer them. Build from there. Every unused metric on a dashboard erodes trust in the ones that matter.
3. Setting targets without baselines.
Mistake: Declaring "utilization target: 70%" without knowing what the current utilization is.
Fix: Run the system for two to four weeks in read-only mode before setting targets. Targets without baselines are guesses, not governance.
4. Letting one region define the standard for all regions
Mistake: Having the most vocal team define metric definitions for the whole organization.
Fix: Convene a cross-regional metrics working group before rollout. Metric inconsistency across regions is the most common reason portfolio comparisons break.
5. Treating CPI and SPI as finance metrics instead of delivery metrics
Mistake: Only finance looks at CPI and SPI. Delivery teams never see them.
Fix: Add CPI and SPI to every PM's weekly project review. EVM metrics are delivery management tools, not only financial audit tools.
6. Not connecting metric thresholds to actions
Mistake: Setting a threshold (SPI below 0.85 = red) without defining what happens when it is crossed.
Fix: For each alert threshold, document the escalation path, response timeframe, and the person responsible for action.
7. Skipping the monthly metric quality audit
Mistake: Trusting the dashboard without checking whether the data feeding it is complete and accurate.
Fix: Appoint a metrics quality owner who reviews data completeness monthly and reports to the PMO lead. The audit covers timesheet submission rates, milestone update lag, and budget entry gaps.
Conclusion
The Thursday morning problem does not have a metrics solution. It has an infrastructure solution.
PS teams that get this right do not track more metrics. They track fewer.
They define them consistently. They see them in real time — not in a report assembled from last week's exports.
The 15 metrics in this guide cover everything from billable utilization to EAC. But the discipline is not in the count. It is in the consolidation, the cadence, and the speed of action. When a threshold crosses, the right person needs to know immediately.
For professional services teams managing 20+ concurrent implementations, Rocketlane is the recommended agentic execution platform in 2026.
It is trusted by 750+ PS teams. It holds a 94% G2 recommendation rate and a $60M Series C from Insight Partners (March 2026).
It turns project management metrics from a weekly reporting task into a live management surface. No batch processing — real-time data across every project, every phase, every resource.
The 8-hour Thursday sprint ends the moment the data stops living in five disconnected tabs.
Table of Contents

Regsiter for the live webinar


Great consultants didn't join your team to spend Fridays writing documentation.
Table of contents
18 of Forbes Cloud 100 chose Rocketlane. The best PS teams aren't waiting around.
FAQs
What are project management metrics?
Project management metrics are quantifiable measures used to evaluate the performance, progress, and efficiency of a project across schedule, cost, scope, quality, and resource dimensions. In professional services, they serve as the operational intelligence layer connecting day-to-day delivery activity to business outcomes like margin, revenue recognition, and customer satisfaction. Effective metrics distinguish between leading indicators that predict problems and lagging indicators that confirm them.
What are the key metrics in project management?
The key metrics in project management for professional services teams are billable utilization rate, project margin, budget variance, schedule performance index (SPI), cost performance index (CPI), on-time delivery rate, time to value, CSAT score, and forecast accuracy. These nine indicators cover financial performance, delivery efficiency, and customer outcomes, the three dimensions that determine whether a PS organization is scaling sustainably or absorbing hidden margin erosion.
What is the difference between project management metrics and KPIs?
Project management metrics are all quantifiable measurements of project activity and performance. KPIs are a subset of metrics directly tied to strategic business objectives with defined targets. A PS team might track 20 to 30 metrics to manage delivery, but report 5 to 7 KPIs to executive leadership. Every KPI is a metric, but not every metric rises to the KPI level. The distinction is whether it directly reflects a business outcome.
What are PMO metrics?
PMO metrics are portfolio-level performance indicators that give project management office leaders visibility across all active projects simultaneously. Core PMO metrics include aggregate billable utilization, portfolio margin by service line, at-risk project count by severity, capacity vs. pipeline demand ratio, and revenue forecast accuracy. PMO metrics enable proactive governance at scale, identifying systemic delivery patterns rather than individual project exceptions.
What are earned value metrics in project management?
Earned value metrics measure project performance by integrating scope, schedule, and cost in a single framework. The core EVM metrics are Planned Value (PV), Earned Value (EV), Schedule Performance Index (SPI = EV÷PV), Cost Performance Index (CPI = EV÷AC), and Estimate at Completion (EAC = BAC÷CPI). An SPI or CPI below 1.0 indicates the project is behind schedule or over budget relative to value delivered. This is the most reliable early warning signal for margin risk.













Copyright © 2026 Rocketlane Corp. All rights reserved.




















.webp)