How to improve project profitability and stop discovering margin problems too late (A complete guide for 2026)


•
•
Summarize blog with






A project looks profitable until the last 10% of delivery proves otherwise.
Most teams discover profitability problems when it is already too late to fix them. By the time the P&L shows red, the resources are spent, and the margin is gone.
By the time margins look off, the work is already done, the resources are spent, and there is no room to recover.
Profitability is not lost in one bad decision. It is lost in a thousand small ones — delayed timesheets, incorrect resource assignments, untracked scope changes — that silently accumulate during execution. It is not a finance metric you review after delivery.
It is an operational signal that should guide every decision during execution.
When teams treat profitability as a retrospective report instead of a live control system, margin erosion becomes invisible until it is irreversible. The difference between average and high-performing teams is not how they report profitability. It is how early they can act on it.
Project profitability depends on controlling cost, time, and scope during execution — not reviewing outcomes after delivery.
What is project profitability?

Project profitability is the ability to track and maximize revenue, cost, and margin in real time during execution.
At a basic level, it comes down to three components:
- Gross profit = Project revenue − Direct costs
- Net profit = Gross profit − Overheads
- Profit margin = (Profit ÷ Revenue) × 100
This is the core project profitability formula used across professional services teams. It gives you a clear view of whether a project is actually profitable, not just generating revenue.
Project Profitability Metrics: Beyond gross and net profit, architects and engineers should track additional metrics to evaluate a project's financial success.
In practice, project profitability in project management goes beyond a final calculation. It depends on how accurately you estimate effort, how efficiently you allocate resources, and how closely actual execution matches the original plan.
Two projects with the same revenue can deliver completely different outcomes based on these factors.
For example, a fixed-fee implementation priced at $50,000 may look successful on paper. But if the team overruns effort by 20% or assigns higher-cost resources than planned, the margin drops significantly.
Without visibility into costs during execution, teams discover the loss only after delivery.
That is why project profitability changes with every staffing decision, hour logged, and scope change during delivery.
Why is project profitability invisible until it's too late?
Project profitability is hard to track in real time because the data required to measure it is fragmented, delayed, and disconnected from how work actually happens.
Most teams are not missing data. They are missing connected, timely signals that reflect what is happening during execution.
Here are the four root causes:
1. Fragmented systems
Project data lives in one tool, time tracking in another, and financials in a third. Teams often rely on spreadsheets to combine this data, which delays visibility and introduces errors. By the time a project profitability report is created, the numbers are already outdated.
2. Delayed timesheets
Time tracking is often incomplete or submitted late. Since labor cost is the biggest driver of project profitability, even small delays distort margin calculations. This directly impacts revenue recognition and makes real-time tracking unreliable.
3. Resource switching blind spots
Resources frequently move between profitable projects. Without accurate tracking of who worked on what and at what cost, teams lose visibility into true project expenses. This creates gaps in project profit-and-loss calculations and leads to incorrect margin assumptions.
4. No phase-level visibility
Most teams track profitability at the project level, not at the phase or task level. This hides where margin erosion actually happens. A single overrun phase can wipe out overall profitability, but it often goes unnoticed until the end.
Project Profitability vs Project Revenue: What’s the difference?

Project profitability and project revenue are closely related, but they measure very different outcomes.
Project revenue tells you how much money a project brings in. Project profitability indicates how much money you actually keep after covering delivery costs. Focusing only on revenue can hide serious margin issues.
Here is a clear breakdown:
The key risk is simple. You can grow revenue while destroying profitability.
For example, a project that generates $100,000 in revenue may look successful. But if it costs $85,000 to deliver due to poor resource allocation or scope creep, the margin is weak. Scale this across multiple projects, and the business grows top-line revenue while profitability declines.
What are the key metrics to track for project profitability?
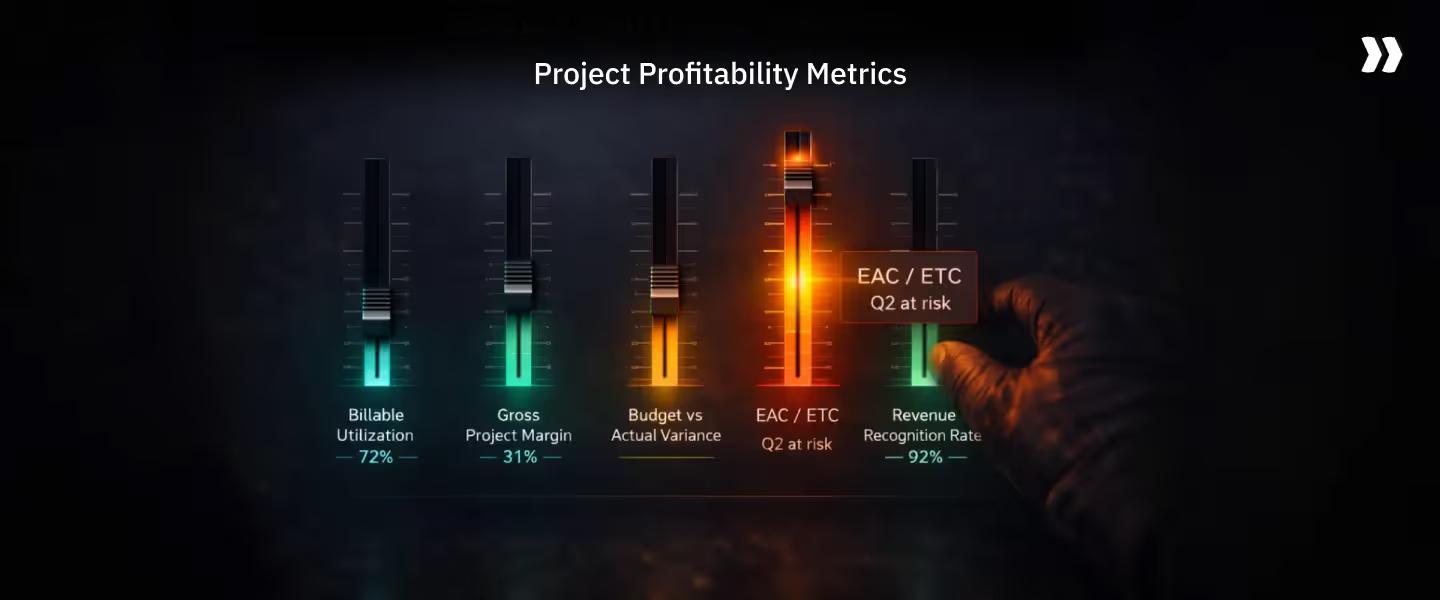
The key metrics to track for project profitability are utilization, margin, budget vs actual cost, estimate accuracy, and revenue recognition. Together, they show whether a project is financially healthy while it is still in progress, not after it is complete.
Most teams track project profitability at a summary level. High-performing teams track it across execution, resources, and financial health signals in real time.
Here are the core project profitability metrics:
1. Billable utilization (65–80% target)
This measures how much of your team’s time is spent on billable work. It is one of the strongest indicators of profitability potential.
Low utilization means you are paying for capacity that is not generating revenue. High utilization without control can lead to burnout and quality issues. The goal is a balanced range where teams are productive but sustainable.
2. Gross project margin (30–45% target)
This is the most direct measure of profitability. It shows how much profit remains after delivery costs.
Even small changes in staffing or time overruns can significantly impact margin. Tracking this during execution helps prevent margin erosion instead of reporting it later.
3. Budget vs actual cost
This compares planned cost with actual cost incurred. It highlights whether a project is running within its financial boundaries.
A consistent gap between budget and actual is a sign of poor estimation or uncontrolled scope. This metric is critical for any project profitability analysis.
4. Estimate at Completion (EAC) and Estimate to Complete (ETC)
EAC estimates the total project cost based on current progress. ETC shows how much more cost is expected to complete it.
These metrics allow teams to forecast profitability before the project ends. Without them, teams operate blindly until it is too late to act.
5. Revenue recognition rate
This tracks how and when revenue is recognized as work progresses. It is especially important for projects with milestone or time-based billing.
Delays in time tracking or approvals directly impact revenue visibility and cash flow, which affects overall project profitability management.
6. Project profitability index and ratios
Advanced teams use profitability ratios to compare performance across projects.
This includes metrics like profit margin percentage, cost variance, and return on investment ROI. These indicators help standardize project profitability assessment across teams.
These metrics also help teams unlock profitability potential and drive long-term profitability enhancement across projects.
The margin intelligence stack: How high-performing teams protect project profitability
The Margin Intelligence Stack is a four-layer operating model that high-performing professional services teams use to protect and improve project profitability in real time. It integrates estimation, execution, resource decisions, and revenue recognition into a single continuous system.
Most teams operate these layers in isolation. That is why profitability becomes visible only after delivery. When all four layers work together, profitability becomes predictable and controllable.
Layer 1: Estimation engine
This is where project profitability is decided before the project even starts.
The estimation engine defines:
- Scope, effort, and timelines
- Resource mix and cost assumptions
- Expected revenue and margin targets
The problem is not estimation itself. It is the lack of feedback from actual execution.
Most teams estimate once and move on. High-performing teams continuously refine estimates using historical project profitability analysis. They compare planned vs actual effort at a phase and task level, then feed those insights back into future estimates.
In practice:
- If integration work consistently overruns by 15%, future estimates are adjusted
- If junior resources can handle 60% of tasks, the cost assumptions improve
- If certain project types show lower margins, pricing models are corrected
Without an estimation engine that reflects actual delivery data, projects start with inaccurate cost and effort assumptions.
Layer 2: Real-time execution layer
This layer answers a simple question: What is happening to your margin right now?
Execution is where most margin leakage happens. But most teams track progress, not profitability.
A real-time execution layer connects:
- Time tracking
- Task completion
- Budget consumption
- Phase-level cost burn
This allows teams to see:
- Which phase is overrunning
- Which tasks are consuming more effort than planned
- How close the project is to breaching its budget
For example: If 40% of the budget is consumed at only 20% project completion, that is an early margin risk signal. Teams can intervene immediately instead of discovering the issue at the end.
Without this layer, project profitability dashboards become historical reports instead of control systems.
Layer 3: Resource-cost optimizer
Resources are the single biggest driver of project profitability.
Assign a senior consultant to a task that a mid-level resource could handle, and you lose 15-20 points of margin instantly — even if the work gets done on time.
This layer ensures:
- The right skill level is assigned to each task
- Cost rates are aligned with project budgets
- Utilization stays within the 65–80% target range
The most common mistake is assigning based on availability rather than cost efficiency.
For example:
- A senior consultant assigned to a task that a mid-level resource could handle reduces the margin instantly
- Underutilized team members increase the cost per project
- Overallocated resources lead to delays and rework
High-performing teams use skills-based allocation and continuously optimize resource mix based on cost impact.
This is where project profitability management becomes operational rather than theoretical.
Layer 4: Revenue recognition engine
This layer determines when and how revenue is recognized as work progresses.
Even if a project is profitable on paper, delayed or incorrect revenue recognition can distort financial visibility.
This layer connects:
- Time tracking and billing
- Milestone completion
- Contract terms (fixed fee, T&M, subscription)
It ensures:
- Revenue is recognized in sync with actual delivery
- Invoices are triggered on time
- Financial reporting reflects true project performance
For example: If timesheets are delayed or incomplete, revenue recognition slows down. This affects cash flow and obscures the true state of the project's profitability.
High-performing teams treat revenue recognition as part of delivery, not just finance.
What breaks when the stack is incomplete
When one layer is missing, project profitability becomes unreliable:
- Without the Estimation Engine, projects start with incorrect margin assumptions
- Without the Real-Time Execution Layer, issues are discovered too late
- Without the Resource-Cost Optimizer, margins erode silently during delivery
- Without the Revenue Recognition Engine, financial visibility becomes distorted
Most teams have parts of this system. Very few connect all four.
That is the difference between reacting to profitability and controlling it.
How to improve project profitability: 7 Proven strategies
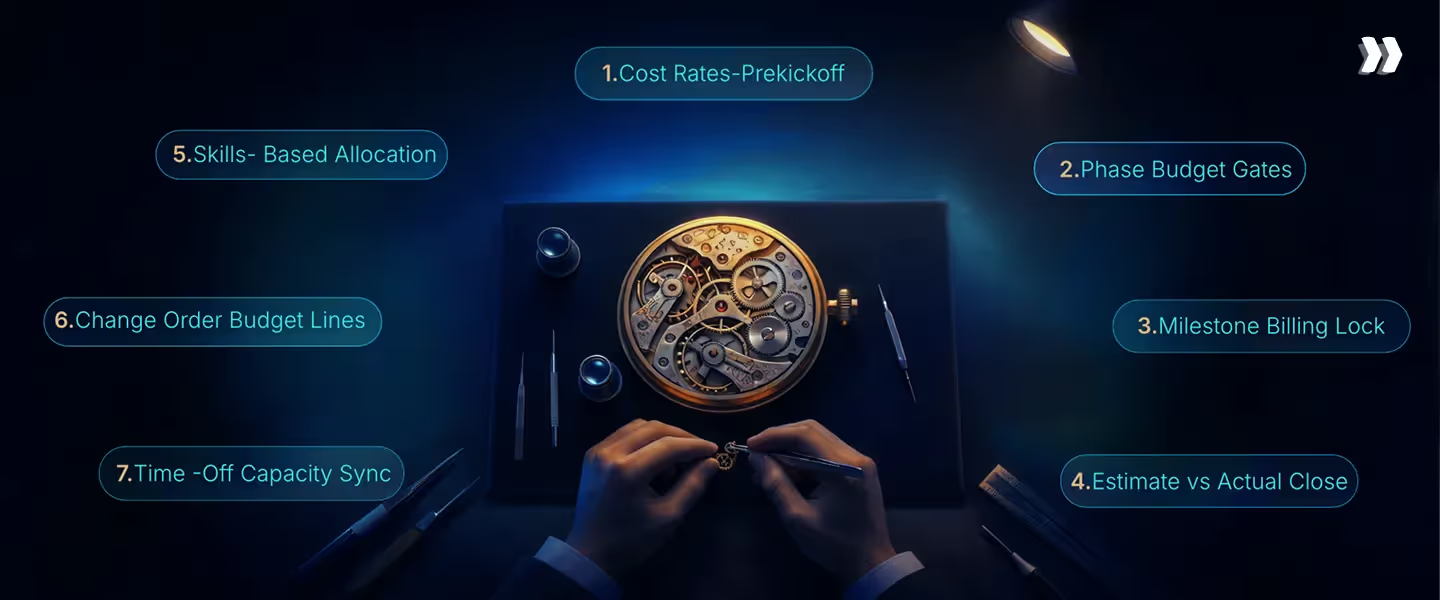
Most teams treat profitability as a post-delivery report. High-performing teams treat it as a live control system. The difference is not what they measure — it is when they act on it.
Most teams focus on reporting profitability. High-performing teams build systems that protect margins during execution. The difference comes down to a few consistent practices that directly impact cost, utilization, and delivery efficiency.
Here are seven proven strategies used by teams that consistently deliver projects profitably:
1. Connect cost rates to resource plans before kickoff
Profitability starts with knowing the true cost of your team.
- Assign cost rates at both the role and individual levels
- Align resource mix with project budget, not just availability
- Model cost impact before finalizing staffing
When cost rates are disconnected from planning, projects look profitable on paper but fail during execution. This is one of the most common gaps in project profitability management.
2. Set phase-level budget thresholds
Project-level tracking hides where margin loss actually happens.
- Break budgets into phases or milestones
- Define thresholds, such as 80% budget consumed alerts
- Track burn rate at the phase and task level
This allows teams to catch issues early. For example, if one phase overruns by 20%, you can correct the course before it impacts the entire project.
3. Gate milestone billing on timesheet approval
Revenue visibility depends on accurate time tracking.
- Enforce timesheet submission before billing triggers
- Set approval workflows for billable hours
- Prevent invoicing based on incomplete data
Delayed or inaccurate timesheets distort both cost and revenue. Fixing this improves revenue recognition and the accuracy of overall project profit and loss.
4. Build an estimate vs actual feedback loop
Estimation improves only when it learns from execution.
- Track planned vs actual effort for every project
- Identify consistent overrun areas
- Feed insights back into future estimates
Most teams estimate once and move on. High-performing teams treat estimation as a continuous system. This is critical for long-term profitability optimization.
5. Use skills-based allocation, not availability-based
Who you assign matters as much as what you deliver.
- Match tasks to the lowest-cost capable resource
- Avoid overusing senior resources for standard tasks
- Balance utilization across teams
Assigning based on availability alone leads to higher delivery costs. Skills-based allocation improves margins without affecting quality.
6. Track change orders as separate budget lines
Scope changes are one of the biggest causes of margin leakage.
- Create separate budget entries for every change request
- Track revenue and cost independently
- Avoid mixing the original scope with the new work
Without clear tracking, additional work gets absorbed into the original budget. This silently reduces profitability.
7. Pull time-off data into your capacity model
Capacity planning is incomplete without availability data.
- Integrate PTO and holidays into resource planning
- Adjust allocations proactively
- Prevent overcommitment and last-minute reshuffling
Unplanned time off creates gaps that lead to delays, rework, and increased costs. Accurate capacity planning helps deliver projects profitably at scale.
Project profitability benchmarks: What does good look like?
Strong project profitability is not subjective. It is measurable. High-performing teams operate within clear benchmark ranges that indicate healthy delivery, efficient resource use, and controlled costs.
Here are the key benchmarks to track:
Billable utilization (65–80%)
- Measures how much of your team’s time generates revenue
- Below 65% indicates underutilization and lost revenue potential
- Above 80% can lead to burnout, delays, and quality issues
- Balanced utilization ensures sustainable profitability and delivery efficiency
Gross project margin (30–45%)
- Shows how much profit remains after delivery costs
- A good profit margin for professional services typically falls in this range
- Margins below 30% often indicate poor cost control or inefficient execution
- High-performing teams protect margin by managing resources and scope in real time
Budget variance (≤10%)
- Compares planned cost vs actual cost
- Variance above 10% signals estimation gaps or scope creep
- Consistently high variance reduces predictability across projects
- Tight variance control improves project profitability analysis accuracy
Time to invoice (as early as possible)
- Measures how quickly revenue is billed after work is completed
- Delays impact cash flow and distort financial visibility
- Late invoicing often comes from delayed timesheets or approval gaps
- Faster billing cycles improve overall project profit and loss clarity
Estimate accuracy (≥85%)
- Compares estimated effort vs actual effort
- Low accuracy leads to repeated margin loss across projects
- High-performing teams track estimate vs actual at the phase level
- Continuous feedback loops improve long-term profitability potential
Common Challenges in Project Profitability (and how to fix them)
.avif)
Even teams that track project profitability struggle with consistent margins. The issue is not a lack of effort. There are structural gaps in how projects are planned, executed, and measured.
Here are the most common challenges and how to fix them:
Multi-currency complexity
Why does it happen:
Global teams operate across regions with different cost rates and billing currencies. This creates inconsistencies in cost tracking and revenue reporting.
Fix:
Standardize cost rates by region and convert all financial data into a single base currency for reporting. Maintain a clear mapping between local costs and global margins to avoid distortions in project profitability analysis.
Mixed billing models in one project
Why does it happen:
Projects often combine fixed-fee, time-and-materials, and subscription components. Without structured tracking, it becomes difficult to measure true profitability.
Fix:
Track each billing component as a separate budget line with its own cost, revenue, and margin. Then consolidate at the project level to provide a clear project profit-and-loss view.
Resource switching erases cost attribution
Why does it happen:
Resources frequently move between projects. Without accurate tracking, teams lose visibility into who contributed what cost to each project.
Fix:
Track time and cost at the individual resource level. Ensure that every logged hour is tied to a specific project and task. This preserves accurate cost attribution and improves project profitability management.
No feedback loop from actuals to estimates
Why does it happen:
Most teams estimate once and do not revisit assumptions. This leads to repeated cost overruns and declining margins across projects.
Fix:
Build a system that compares estimated vs actual effort for every project. Identify patterns of overruns and refine future estimates using real data. This is critical for optimizing long-term profitability.
These challenges vary across project profitability use cases, especially in global and multi-project environments.
What to look for in project profitability software
Choosing the right project profitability software is not about features. It is about whether the system helps you track, predict, and improve margins during execution, not after delivery.
Here are the capabilities that actually matter:
- Real-time profitability visibility across projects: The system should show revenue, cost, and margin as work progresses. You should be able to track project profitability at the project, phase, and task level without waiting for reports.
- Unified data across delivery and financial systems: Look for a platform that connects project management, time tracking, resource planning, and financial data. This removes manual reconciliation and ensures your project profitability analysis is accurate.
- Resource planning with cost impact visibility: The tool should allow you to assign resources based on skill and cost, not just availability. You should be able to see how staffing decisions affect margins before and during execution.
- Flexible revenue recognition and billing support: Your system should handle fixed fee, time and material, and hybrid billing models. Revenue recognition should align with actual work completed to maintain accurate financial visibility.
- Forecasting and early risk detection: The platform should provide signals such as budget burn, estimate at completion, and margin risk alerts. This allows teams to act early rather than react after profitability declines.
What to avoid
- Tools that require exporting data into spreadsheets for reporting
- Systems that track revenue but not delivery costs in real time
- Platforms that do not support multi-project or multi-billing scenarios
- Solutions that rely heavily on manual inputs without validation
How Rocketlane Helps Teams Control Profitability During Delivery

Rocketlane is an agentic-AI-powered PSA platform that helps enterprises, top services, and SaaS organizations increase their project profitability and predict their profitability margins using state-of-the-art Agentic AI solutions.
Here are certain features of Rocketlane that stand out to improve your project profitability -
- Real-time project profitability dashboards: Instead of waiting for reports, teams can see margin risk as it builds in real time during execution. Instead of relying on delayed reports, teams can track budget burn, margin trends, and project performance as work progresses.
- Unified platform for delivery and financial data: Eliminate fragmented systems by bringing project management, time tracking, resource planning, and financials into one system. Time tracked on tasks directly feeds into cost and margin calculations, removing the need for manual reconciliation.
- Flexible revenue recognition across billing models: Support fixed fee, time and material, and subscription models within the same project. Align revenue recognition with actual delivery progress to maintain accurate financial visibility and avoid reporting gaps.
- Multi-budget and multi-billing tracking: Manage complex projects with multiple scopes by tracking each component as a separate budget line. Maintain clear visibility into individual and overall project profitability without mixing costs and revenue across scopes.
- Cost rate management with version control: Assign cost rates at the role and individual levels, with support for regional variations and project-specific overrides. Track changes over time without affecting historical data, ensuring accurate project profitability analysis.
- Skills-based resource allocation with margin impact visibility: Allocate resources based on skill fit and cost efficiency, not just availability. Understand how each staffing decision affects project margins and optimize resource mix to stay within profitability targets.
- Built for accurate project profitability analysis at scale: Replace spreadsheets and disconnected tools with a system designed to track profitability across multiple projects. Generate consistent project profitability reports and dashboards without manual effort.
- Designed for professional services teams managing complex delivery: Ideal for teams that need to track profitability across multiple projects, regions, and billing models while maintaining control over margins and utilization.
How Nitro Agents Improve Project Profitability

Most teams try to improve project profitability by tracking more data. The real shift happens when profitability becomes a continuous operational system embedded in daily delivery work.
Rocketlane's AI intelligence layer, Nitro, improves project profitability by preventing margin leakage during execution, enforcing governance rules in real time, and handling repetitive delivery work so your best people focus on what actually needs them.
Instead of reacting to margin problems after they arise, teams can act earlier and exercise better control over cost, time, and outcomes.
Here is how each capability directly impacts profitability:
- Timesheet governance for accurate revenue and cost tracking: Nitro Time Approver applies time-logging rules automatically as people log time — before entries hit the approver queue. Every hour is directly tied to the project, milestones, billing, and margin. This prevents late or incorrect entries that delay revenue recognition and distort visibility into project profitability.
- Resource optimization with cost-aware allocation: Allocate resources based on skill fit, availability, and cost impact. Avoid overusing expensive resources and maintain utilization within target ranges to protect margins across projects.
- Project governance to prevent margin leakage early: The Nitro Project Architect monitors delivery in real time, flagging milestone drift, stalled dependencies, budget pressure, and client-side inactivity. It governs scope, timelines, and margin — surfacing risks with suggested fixes before they compound into margin loss.
- AI analyst for faster profitability insights: Nitro's AI Analyst answers profitability questions on demand — revenue variance, margin movement, resource bottlenecks, project health — without manual reporting. Ask it, get an answer in seconds. No more chasing teams for explanations or building spreadsheets for reviews.
- Workforce automation to reduce delivery effort: Automate repetitive tasks such as documentation, configuration, and data handling. Reduce hours spent on non-billable work and increase team capacity without adding headcount.
- Signals to detect risks and opportunities early: Monitor customer interactions and project activity to identify churn risks, scope creep, and expansion opportunities. Act early to protect revenue and prevent margin erosion.
Conclusion
Most teams discover margin problems too late because they treat project profitability as a reporting function. By the time the P&L shows red, the resources are spent, and the window to recover has closed.
The teams that consistently protect margins do one thing differently: they act on profitability signals during execution, not after delivery.
That means connecting estimation to actuals, tracking budget burn at the phase level, enforcing timesheet governance, and allocating resources based on cost efficiency — not just availability. None of these is complex. All of them require the right system.
The Margin Intelligence Stack gives you a framework for building that system: Estimation Engine → Real-Time Execution Layer → Resource-Cost Optimizer → Revenue Recognition Engine. When all four layers work together, profitability stops being a surprise and starts being a controllable outcome.
The benchmarks to aim for:
- Billable utilization: 65–80%
- Gross project margin: 30–45%
- Budget variance: ≤10%
- Estimate accuracy: ≥85%
If your team is still reconciling costs in spreadsheets, waiting for month-end reports, or discovering overruns in the final 10% of delivery, the problem is not effort. It is infrastructure.
Rocketlane integrates delivery, resources, and financials into a single real-time system. Nitro surfaces margin risks before they compound, enforces governance without manual intervention, and gives leadership accurate answers on demand.
Table of Contents

Regsiter for the live webinar


Great consultants didn't join your team to spend Fridays writing documentation.
Table of contents
18 of Forbes Cloud 100 chose Rocketlane. The best PS teams aren't waiting around.
FAQs
What are the key metrics to track for project profitability?
Key metrics include billable utilization, gross margin, budget vs actual cost, estimate accuracy, and revenue recognition rate. These metrics help teams monitor financial performance during execution and identify risks before they impact overall to boost project profitability.
What is the project profitability index?
The project profitability index is a ratio that measures the value generated per unit of cost. It helps compare projects by showing how efficiently resources are used to generate profit, making it useful for prioritization and investment decisions.
How can I improve the profitability of my projects?
You can improve project profitability by tracking costs in real time, optimizing resource allocation, controlling scope changes, and building feedback loops between estimates and actuals. Acting early on margin risks is key to consistent profitability.
What is the best way to track profitability across projects for a service business?
The best way to track profitability across projects for a service business is to use a unified system that connects time tracking, resource planning, and financial data. This provides real-time visibility into project profitability dashboards, reports, and margin trends across the portfolio.
How to analyze project profitability?
To analyze project profitability, compare project revenue against total costs, including labor, resources, and overhead. Track metrics like gross margin, budget vs actual cost, and estimate accuracy in real time to identify where margins are improving or declining during execution.













Copyright © 2026 Rocketlane Corp. All rights reserved.



















.webp)