Resource utilization: The complete guide for professional services teams (2026)


•
•
Summarize blog with






Most PS leaders can tell you their utilization number. Almost no one can explain why it is dropping or what to do about it before revenue takes the hit.
On paper, it looks simple. You take available hours, compare them to billable hours, and get a percentage. In reality, it is where most teams lose money, overwork their best people, and miss growth opportunities without realizing it.
If you are leading a professional services team, this will sound familiar. You are constantly trying to answer basic questions that should be easy.
Who is available next month? Who is already overbooked? Can we take on this new project without hiring? The problem is not a lack of data. The problem is a lack of clarity.
Most teams rely on spreadsheets, disconnected tools, and delayed reports to track resource utilization.
By the time the numbers are ready, they are already outdated. This leads to two extremes. Either your top performers are running at 120 percent, while others sit underutilized. Or you slow down new work because you are unsure of your actual capacity.
Poor utilization shows up in three places: lower revenue per employee, eroded margins due to poor staffing, and burned-out top performers covering for idle capacity. High-performing teams do not wait for month-end reports. They see utilization drop in real time and rebalance the workload the same day.
In this guide, you will learn how resource utilization actually works in modern professional services teams. We will break down the formula, the metrics that matter, and the common mistakes that hold teams back.
More importantly, we will show you how to move from reactive tracking to proactive optimization, so your team can scale without chaos.
What is resource utilization?

Resource utilization is the percentage of available working hours spent on productive or billable work. In professional services, it measures how efficiently teams convert capacity into revenue.
At a basic level, it answers a simple question. Out of the total time your team is available to work, how much of that time is actually generating value for the business?
For example, if a consultant has 40 available hours in a week and spends 32 hours on billable work, their resource utilization rate is 80 percent. The remaining time usually goes into internal meetings, admin work, or bench time.
This sounds straightforward, but most teams struggle to measure it accurately. Data sits across different tools, time tracking is inconsistent, and reports are delayed.
By the time leaders review a resource utilization report, the situation has already changed. This is why many teams operate with limited visibility into actual capacity and workload.
Resource utilization vs resource allocation
Resource allocation is about assigning the right people to the right work. Resource utilization measures how effectively that work turns into productive output.
You can allocate a project perfectly on paper and still end up with poor utilization if work is delayed, overstaffed, or misaligned with skills.
Resource utilization vs capacity utilization
Capacity utilization looks at total available time across the team. Resource utilization focuses on how much of that time is used for productive or billable work.
Capacity tells you what you could do. Utilization tells you what you actually did.
Who owns utilization?
Resource utilization is not owned by one function. It sits across multiple roles.
Professional services leaders are accountable for overall performance. PMO teams track delivery and reporting. Resource management teams or operations leaders manage staffing and availability.
When ownership is unclear, utilization becomes a lagging metric instead of a controllable system.
Understanding this foundation is critical. Because once you see how utilization works, the next question becomes obvious. How much is it really costing you when it goes wrong?
Why resource utilization matters — the business case
Resource utilization is not just an operational metric. It directly drives decisions on revenue, margins, and growth.
When utilization is low, you are paying for capacity that is not generating revenue.
When it is too high, you are pushing your team toward burnout and risking the quality of delivery. The goal is not maximum utilization. It is effective resource utilization that balances revenue and sustainability.
Revenue per employee
Resource utilization directly impacts revenue per employee. The more billable hours your team delivers, the more revenue you generate without increasing headcount.
A team operating at 60 percent utilization is leaving a significant portion of its capacity unused. Moving that to 75 or 80 percent increases output without hiring. This is one of the fastest ways to improve financial performance.
Margin erosion from poor staffing
Poor resource allocation leads to margin loss. When you assign high-cost senior resources to work that does not require their expertise, you reduce profitability. When projects are understaffed or delayed, costs increase without a corresponding increase in revenue.
Without a clear resource utilization analysis, these issues are often discovered too late, after the margin is already impacted.
Capacity decisions: hire or delay
Leaders constantly face a critical question. Do we have the capacity to take on new work?
Without accurate visibility into resource utilization rate and future demand, this becomes guesswork. Some teams hire too early and carry unnecessary bench costs. Others delay projects or turn down work because they assume they are at capacity.
Accurate utilization data enables better decisions. You can forecast demand, understand gaps, and plan hiring with confidence.
Burnout vs bench
Poor utilization creates an imbalance. Some team members operate at 120 percent while others remain underutilized. This leads to burnout at one end and wasted capacity at the other.
A balanced workload is key to maintaining team health and performance. It also improves retention, which directly impacts long-term profitability.
This is the real cost of poor resource utilization. Not just inefficiency, but lost revenue, lower margins, and slower growth.
Understanding this makes one thing clear. Resource utilization is not a reporting problem. It is a business performance problem.
Core concepts behind resource utilization
Understanding resource utilization requires clarity on a few closely related terms. Most teams mix these up, which leads to poor decisions and misleading reporting. This section breaks down the core concepts so you can read your numbers correctly.
Billable vs non-billable utilization
Billable utilization refers to time spent on work that generates revenue.
Non-billable utilization includes internal meetings, training, admin work, and bench time.
High-performing teams track both. If you only track billable hours, you miss where time is actually going. If non-billable work is too high, it directly reduces your overall resource utilization rate.
Realization vs utilization
Utilization measures how much of your available time is used for work. Realization measures how much of that work is actually billed and collected.
A team can have high utilization but low realization if work is written off, discounted, or mis-scoped. This is where margin loss happens.
Planned vs actual utilization
Planned utilization is what you expect based on project allocation. Actual utilization is what really happens based on the time tracked.
The gap between the two is where problems show up. Delays, scope creep, or poor estimation all reduce actual utilization relative to planned utilization.
Utilization vs efficiency
Utilization focuses on time usage. Efficiency focuses on output for that time.
A resource can be fully utilized but still inefficient if work takes longer than expected. This is why utilization alone is not enough. You need to look at how effectively that time is used.
Quick comparison table
Most teams struggle with resource utilization, not because they lack data, but because they interpret it incorrectly. Once these concepts are clear, it becomes easier to identify where utilization is breaking down and what needs fixing.
Types of resource utilization

Resource utilization is not a single number. It needs to be viewed across different levels to understand what is actually happening in your organization.
Looking at only one layer often hides problems. A team might look fully utilized overall, while specific roles or individuals are either overloaded or underused.
Individual utilization
This measures how effectively each team member is using their available time.
It helps answer questions like:
- Who is overutilized and at risk of burnout
- Who is underutilized and has capacity
- Where the workload is uneven
Without this view, high performers often get overloaded while others remain on the bench.
Team utilization
This looks at utilization across a group or department.
It provides a high-level view of how efficiently a team operates. Leaders use this to track overall performance, but it can hide imbalances within the team if not paired with individual data.
Role-based utilization
This focuses on utilization by role, such as consultants, project managers, or technical specialists.
It helps identify skill gaps and hiring needs. For example, you might have strong overall utilization, but a specific role could be overbooked, creating delivery bottlenecks.
Project-level utilization
This tracks how resources are utilized within a specific project.
It helps assess whether a project is properly staffed and whether effort is aligned with scope. Poor project-level utilization often leads to budget overruns or missed timelines.
Capacity vs billable utilization
Capacity utilization looks at total available working time across the team. Billable utilization focuses only on revenue-generating work.
Both are important. Capacity tells you what you can deliver. Billable utilization shows how much of that capacity is actually generating revenue.
Understanding these types of resource utilization gives you a complete view of your operations. It helps you move from a single percentage to a structured resource utilization analysis that highlights where improvements are needed.
Resource allocation vs resource utilization

Resource allocation is the process of assigning resources to work. Resource utilization measures how efficiently work is executed.
These two are closely related, but they are not the same. Many teams assume that if a project is staffed, the job is done. In reality, staffing is only the starting point. What matters is how effectively that capacity is used.
The common mistake
Most teams focus heavily on resource allocation. They spend time deciding who should work on which project. But once the work starts, there is limited visibility into how that time is actually spent.
This leads to a false sense of control. Projects look fully staffed, but resource utilization tells a different story. Work gets delayed, effort is uneven, and productivity drops.
Key differences
Why this matters
You can have perfect resource allocation on paper and still have poor results.
- Overstaffed projects reduce margins
- Understaffed projects delay delivery
- Misaligned skills increase effort and rework
Without tracking resource utilization, these issues go unnoticed until it is too late.
The shift to make
Teams that perform well do not stop at allocation. They continuously measure utilization and adjust in real time.
They treat resource allocation as a plan and resource utilization as the feedback loop that tells them whether the plan is working.
How to calculate resource utilization
At its core, resource utilization is simple to calculate. The challenge is not the formula but how accurately you calculate the resource utilization rate using real data.
Step 1: Define capacity
Start by identifying available hours.
This includes total working hours minus time off, holidays, and non-working days. If this number is wrong, everything that follows will be inaccurate.
Step 2: Track time
Capture actual hours spent on work.
This is where most teams fail. Inconsistent time tracking leads to unreliable resource utilization data. If your inputs are weak, your output is useless.
Step 3: Calculate utilization
Apply the formula using billable hours and available hours.
For example:
- Available hours = 40
- Billable hours = 32
- Resource utilization rate = 80 percent
Step 4: Segment the data
Do not stop at a single number.
Break utilization down by:
- Individual
- Team
- Role
- Project
This turns a basic calculation into a meaningful resource utilization analysis.
Step 5: Analyze trends
Look at utilization over time, not just a single snapshot.
Track patterns weekly or monthly. Identify:
- Overutilized resources
- Underutilized capacity
- Consistent gaps between planned and actual
Common failure modes
Even with the right formula, teams get this wrong.
- Tracking utilization monthly instead of in real time
- Relying on spreadsheets that are already outdated
- Ignoring non-billable work
- Not segmenting data across roles or projects
- Treating utilization as a report instead of a decision tool
The formula gives you the number. The real value comes from how quickly you can act on it.
Resource utilization in project management
Resource utilization sits at the center of project execution. Every delay, overrun, or missed deadline usually ties back to how resources were planned and used.
For project managers, utilization is not just a metric. It is a daily control system.
Staffing projects
Staffing decisions directly impact resource utilization in project management.
If you assign too many people, utilization drops, and margins suffer. If you assign too few, timelines slip, and teams get overloaded. The goal is to match skills, availability, and workload with the actual project need.
Without clear visibility, staffing becomes reactive. Teams end up assigning whoever is available rather than whoever is right for the job.
Managing scope creep
Scope creep quietly destroys utilization.
As projects expand beyond the original plan, resources spend more time than expected without corresponding revenue. This reduces effective utilization and impacts profitability.
Tracking utilization at the project level helps you spot this early. If effort is increasing but the scope has not been updated, you are losing margin.
Effort variance
Effort variance is the gap between planned and actual work.
If a task was estimated at 20 hours but takes 30, that extra time affects utilization across the team. Multiply this across multiple projects, and your entire resource plan breaks down.
Consistent tracking of actual effort helps improve future estimates and stabilizes utilization over time.
Timeline alignment
Project timelines and resource availability must stay aligned.
When timelines shift, but resource plans are not updated, you either end up with idle time or overbooked teams. Both hurt utilization.
Real-time tracking ensures that when schedules change, resource allocation adjusts immediately.
In project management, resource utilization is not something you review at the end. It is something you manage throughout the project lifecycle.
Resource utilization strategies that actually work
You know your utilization is 62 percent. What you do not know is where the other 38 percent is going — or how to get it back.
The difference comes down to systems, not effort. The strategies below are what actually move the needle.
Capacity planning
You cannot improve resource utilization without knowing your true capacity.
This means understanding:
- Total available hours
- Planned allocations
- Future demand from the pipeline
Strong capacity planning helps you answer critical questions early. Do we have room for new work? Do we need to hire? Where are the gaps?
Without this, utilization becomes reactive.
Skill-based staffing
Not all resources are interchangeable.
Assigning work based on availability alone leads to poor outcomes. Work takes longer, quality drops, and utilization efficiency suffers.
Skill-based staffing ensures:
- The right person is assigned
- Work is completed faster
- Less rework and overrun
This improves both utilization and margins.
Forecasting demand
Utilization is not just about today. It is about what is coming next.
Forecasting demand helps you align upcoming projects with available capacity. This reduces last-minute staffing issues and prevents both overutilization and idle time.
Teams that forecast well make better hiring and scheduling decisions.
Load balancing
One of the biggest issues in resource utilization is uneven workload.
Some team members operate at full capacity while others are underutilized. This creates burnout on one side and wasted capacity on the other.
Load balancing distributes work evenly across the team. It keeps utilization within the optimal range and improves team performance.
Standardization
Inconsistent processes reduce utilization.
When every project is handled differently, teams spend more time figuring out what to do instead of executing. This increases non-billable work and lowers efficiency.
Standardizing workflows, templates, and delivery processes reduces friction. It allows teams to execute faster and maintain consistent utilization across projects.
Techniques and tips for improving resource utilization
Most teams know what to fix. The problem is execution. These techniques focus on actions that actually improve resource utilization, as well as on where teams typically fail.
Forecast demand vs supply
How to do it
Map incoming demand from your pipeline against available capacity. Do this weekly, not monthly. Include tentative deals, not just confirmed projects.
This gives you early visibility into gaps and overload.
Failure mode
Teams only look at confirmed work. By the time new deals close, there is no capacity left. This leads to delayed starts and lost revenue.
Use utilization heatmaps
How to do it
Use resource utilization heatmaps to visualize workload across individuals, roles, and teams. Identify who is overutilized and who has capacity.
This makes patterns obvious within seconds.
Failure mode
Teams rely on static reports or spreadsheets. Issues are buried in data and only discovered after escalation.
Reduce non-billable work
How to do it
Track where time is going outside of billable work. Identify repetitive admin tasks, manual reporting, and coordination overhead.
Reduce or automate these areas to free up capacity.
Failure mode
Non-billable work is ignored or grouped into a single category. Teams underestimate how much time is lost, which lowers overall resource utilization efficiency.
Real-time tracking
How to do
Track resource utilization data in real time. Ensure time entries, allocations, and project updates are continuously reflected.
This allows you to act before problems grow.
Failure mode
Monthly or delayed tracking. By the time you review a resource utilization report, the damage is already done.
Scenario planning
How to do it
Model different scenarios. What happens if a project is delayed? What if a key resource is unavailable? What if new deals close earlier than expected?
This helps you prepare for change rather than react to it.
Failure mode
Planning for a single scenario. When reality changes, the entire resource plan breaks down.
Balance workloads
How to do it
Continuously rebalance work across the team. Move tasks from overutilized resources to those with available capacity.
Maintain utilization within an optimal range rather than pushing to extremes.
Failure mode
Relying on the same top performers. Over time, this leads to burnout, while others remain underutilized.
Improving resource utilization is not about a single fix. It is about combining these techniques into a system that provides visibility, control, and speed in decision-making.
Resource utilization challenges

Most resource utilization problems are not caused by a lack of effort. They are caused by broken systems.
Teams work hard to track and improve utilization, but the way data is captured and used creates constant friction. The result is delayed decisions, poor planning, and inconsistent performance.
No visibility
The biggest challenge is not knowing what is happening in real time.
Leaders struggle to answer basic questions about availability, workload, and capacity. Resource utilization data is either incomplete or outdated. By the time issues are visible, it is already too late to fix them effectively.
Tool fragmentation
Data is spread across project management tools.
Project plans sit in one system. Time tracking in another. Resource allocation in spreadsheets. Communication happens over email and chat. There is no single source of truth.
This fragmentation makes accurate analysis of resource utilization almost impossible without manual effort. Most teams rely on multiple resource management software platforms that do not communicate with each other, creating inconsistent data and delaying decision-making.
Manual reporting
A significant amount of time goes into building reports.
Teams pull data from different systems, reconcile inconsistencies, and manually create dashboards. This process is slow and error-prone. It also means decisions are based on stale data.
Instead of improving resource utilization, teams spend time trying to understand it.
Poor forecasting
Forecasting future resource capacity is difficult without reliable data.
Teams either overestimate or underestimate demand. This leads to poor decisions around hiring, project commitments, and scheduling.
Without accurate forecasting, resource utilization becomes reactive instead of planned.
Reactive staffing
Most staffing decisions happen too late.
Projects are staffed based on immediate availability rather than long-term planning.
This leads to overutilized resources in the short term and underutilized capacity in the long term.
Reactive staffing creates a cycle of inefficiency that is hard to break.
These challenges are interconnected. Fixing one without addressing the others does not solve the problem. Improving resource utilization requires a shift from fragmented, manual processes to a unified and proactive system.
The benefits of resource planning

Resource planning is the foundation of strong resource utilization. Without it, utilization becomes reactive and inconsistent. With it, teams gain control over capacity, workload, and performance.
Better utilization accuracy
Planning gives structure to your data.
When capacity, allocation, and demand are clearly mapped, your resource utilization numbers become reliable. You are no longer guessing or reconciling data across systems. You are working with a clear, consistent view of how time is being used.
Faster staffing
With proper planning, staffing decisions become faster and more accurate.
You know who is available, what skills they have, and when they can start. This reduces delays between sales and delivery and improves overall execution speed.
Reduced bench time
Unplanned capacity often leads to idle time.
Resource planning helps you identify gaps early and fill them with the right work. This keeps your team engaged and improves overall resource utilization efficiency without overloading individuals.
Improved margins
Better planning leads to better staffing decisions.
When the right resources are assigned at the right time, projects run efficiently. This reduces overrun, minimizes rework, and protects margins.
Better forecasting
Planning connects current utilization with future demand.
It allows you to forecast capacity needs, plan hiring, and align with sales pipelines. Instead of reacting to changes, you can anticipate them and act early.
Resource planning is not a separate function from resource utilization. It is what makes utilization predictable, controllable, and scalable.
How to build a resource utilization plan
A strong resource utilization plan gives you control over capacity, demand, and execution. Without a plan, utilization is reactive. With a plan, it becomes predictable and scalable.
Here is a simple structure to build one.
- Define targets: Set clear utilization goals based on your business model. For most professional services teams, this sits between 70 and 85 percent. Anything below waste capacity. Anything above risks burnout.
- Map capacity: Understand total available hours across your team. Factor in roles, skills, time off, and non-working days. This becomes your baseline for all planning.
- Implement tracking: Ensure accurate and consistent time tracking. Without reliable data, your resource utilization plan will break down quickly.
- Forecast demand: Align upcoming projects and pipeline with your available capacity. Include expected deals, not just confirmed work, to avoid last-minute surprises.
- Align with sales: Connect delivery planning with sales commitments. This ensures that when deals close, you already have a staffing plan in place.
- Add governance: Set rules for time tracking, staffing, and project execution. Regular reviews, clear ownership, and consistent processes keep the plan working over time.
Resource utilization best practices
Improving resource utilization is not about one-time fixes. It is about consistent habits that keep your system accurate and actionable.
- Weekly reviews: Review resource utilization data every week. Look at gaps between planned and actual, identify overload or bench, and take action early.
- Real-time dashboards: Use a resource utilization dashboard that reflects live data. This removes delays and allows faster decisions on staffing and capacity.
- Scenario modeling: Regularly test different scenarios. What happens if a deal closes early? What if a project slips? This helps you stay prepared rather than react late.
- Enforce time tracking: Make time tracking consistent and mandatory. Without reliable data, even the best resource utilization strategy will fail.
- Role-based targets: Set distinct utilization targets for each role. For example, billable consultants will have higher targets than project managers or support roles. This creates realistic expectations and a better balance.
Resource utilization metrics and dashboard
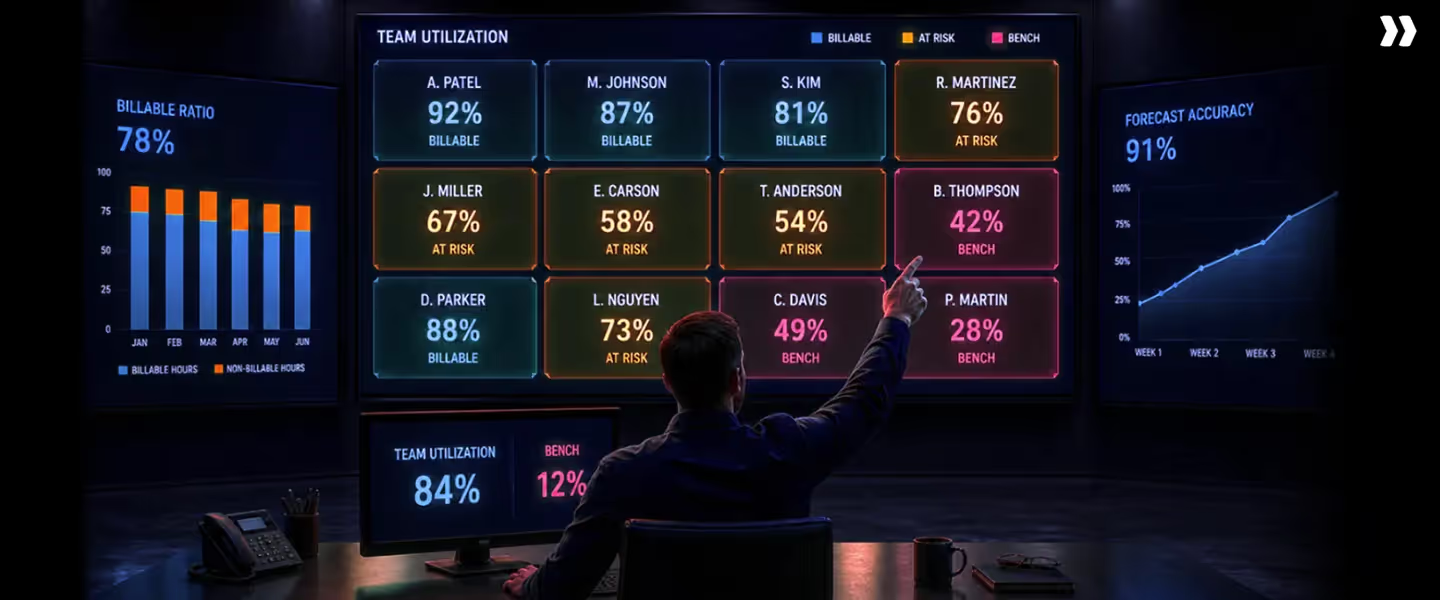
Tracking the right metrics turns resource utilization from a number into a decision-making system.
A good resource utilization dashboard should not just show data. It should highlight what needs attention immediately. Modern resource management tools should not just report utilization, but help teams act on it in real time.
Key resource utilization metrics
What a strong dashboard includes
- Heatmaps: Resource utilization heatmaps show workload distribution across individuals and teams. They help you quickly identify overutilized and underutilized resources.
- Utilization charts: Resource utilization charts and graphs track trends over time. This helps you understand whether utilization is improving, stable, or declining.
- Real-time dashboards: A real-time resource utilization dashboard ensures data is always up to date. This allows faster decisions on staffing, planning, and execution.
Most teams already have some form of reporting. The difference is whether that reporting drives action.
A static resource utilization report shows what happened. A real-time dashboard shows what is happening and what needs to change.
Why Rocketlane has the best resource utilization capabilities

Most tools help you track resource utilization. Very few help you improve it.
Rocketlane is built to move teams from reporting to execution. It connects projects, resources, and financials within a single system, so decisions are faster and more accurate.
Real-time visibility
Instead of waiting for reports, Rocketlane shows utilization in real time. Heatmaps surface overload and idle capacity instantly, so you can rebalance before projects slip.
You can instantly see:
- Who is overutilized
- Who has the capacity
- Where bottlenecks exist
This removes the lag between data and decision-making.
AI-powered allocation
Instead of manual staffing, Rocketlane enables intelligent resource allocation.
It considers:
- Skills
- Availability
- Workload
- Project requirements
This leads to better staffing decisions and improves resource utilization efficiency without extra effort.
Integrated project and resource data
Most teams manage projects and resources in separate systems.
Rocketlane brings them together. This means:
- Project progress directly impacts resource utilization
- Time tracking feeds into real-time analysis
- Allocation and execution stay aligned
This eliminates data fragmentation and improves accuracy.
Forecasting
Rocketlane helps teams forecast future demand and capacity.
You can:
- Predict utilization trends
- Identify gaps early
- Plan hiring and staffing with confidence
This shifts resource utilization from reactive tracking to proactive planning.
Financial visibility
Resource utilization is directly tied to revenue and margins.
Rocketlane connects utilization with financial data so you can:
- Understand revenue per resource
- Identify margin leaks
- Make better pricing and staffing decisions
Rocketlane is not just a resource utilization tool. It is a system that helps you control how work is planned, assigned, and executed.
How Rocketlane Nitro transforms resource utilization
Tracking utilization is not enough. The real impact comes when the system starts making decisions for you. This is where Rocketlane Nitro changes how teams operate.
At the center of this is the Resource Management Agent.
AI staffing
Nitro enables AI-driven staffing based on real conditions, not static plans.
You can ask simple questions like:
- Who is available for a new project
- Who has the right skills for this requirement
- When can we start this engagement
The system analyzes availability, skills, and workload to recommend the best fit. This improves resource allocation and increases overall resource utilization efficiency.
PTO replacement
Unplanned absences often disrupt utilization.
With Nitro, you can instantly find replacements when someone goes on leave. The system identifies resources with similar skills and available capacity, reducing delays and keeping projects on track.
Scenario modeling
Nitro allows you to test different scenarios before making decisions.
For example:
- What happens if a project is delayed
- How does utilization change if a different resource is assigned
- What is the impact on margins
This helps you move from reactive decisions to planned execution.
Natural language insights
Instead of building reports, you can ask questions directly.
- What is our current resource utilization rate
- Who is overutilized
- Where are we losing capacity
The system provides instant insights, making resource utilization analysis faster and easier.
Outcome
With Nitro, teams shift from manually managing utilization to continuously optimizing it.
- Faster staffing decisions
- Better margin control
- Balanced workloads
- Improved resource utilization across the organization
Common resource utilization mistakes and fixes
Most resource utilization issues are not new. Teams know where things go wrong. The problem is that these mistakes repeat because systems are not fixed.
Here are the most common ones and how to address them.
Spreadsheet dependency
- Mistake: Relying on spreadsheets to manage resource utilization and allocation. Spreadsheets are static, error-prone, and quickly outdated. They cannot keep up with changing project demands.
- Fix: Move to a unified system with real-time visibility. This ensures your resource utilization data is always up to date and actionable.
No forecasting
- Mistake: Planning only for current work without considering future demand. This leads to last-minute staffing issues and poor decision-making.
- Fix: Introduce demand forecasting based on pipeline and historical trends. This helps align capacity with upcoming work and improves planning accuracy.
Misaligned staffing
- Mistake: Assigning resources based on availability instead of skills or cost. This results in longer delivery times, rework, and reduced margins.
- Fix: Adopt skill-based resource allocation. Match the right resource to the right work to improve both utilization and efficiency.
Weak governance
- Mistake: Lack of clear rules for time tracking, staffing, and project execution. Without governance, data becomes inconsistent, and decisions become unreliable.
- Fix: Establish clear policies for tracking and allocation. Regular reviews and accountability ensure that the system stays accurate over time.
Poor tracking
- Mistake: Inconsistent or delayed time tracking. This leads to inaccurate resource utilization reports and weak analysis.
- Fix: Enforce consistent time tracking with minimal friction. Make it part of the workflow so data is captured naturally and reliably.
Fixing these issues does not require more effort. It requires better systems and consistent execution.
The future of resource utilization

Resource utilization is moving beyond tracking. The next phase is about prediction, automation, and real-time control.
Predictive capacity planning
Teams are shifting from backward-looking reports to forward-looking models.
Instead of asking what utilization was last month, leaders want to know:
- What will utilization look like next quarter
- Where capacity gaps will appear
- When to hire or rebalance
Predictive capacity planning uses historical data and pipeline signals to answer these questions early.
Autonomous allocation
Manual resource allocation is being replaced by AI-driven systems.
AI agents can:
- Recommend the best resource for a project
- Adjust allocations based on changing timelines
- Replace unavailable resources instantly
This reduces dependence on manual decisions and improves consistency in resource utilization.
Real-time decisioning
Decisions are no longer made in weekly reviews.
With real-time resource utilization dashboards and live data, teams can:
- Identify issues instantly
- Rebalance workloads on the fly
- Adjust plans before problems escalate
Speed becomes a competitive advantage.
From tracking to optimization
The biggest shift is in mindset.
Resource utilization is no longer just a metric to track. It is a system for continuous optimization. Teams that succeed treat it as an active process, not a passive report.
The role of AI-first platforms
This shift is driven by AI-first professional services automation platforms.
These platforms connect:
- Resource utilization data
- Project execution
- Financial performance
They enable teams to move from fragmented tools to a unified system where planning, execution, and optimization happen together.
The future of resource utilization is not about better reporting. It is about making better decisions faster, with less manual effort.
Table of Contents

Regsiter for the live webinar


Great consultants didn't join your team to spend Fridays writing documentation.
Table of contents
18 of Forbes Cloud 100 chose Rocketlane. The best PS teams aren't waiting around.
FAQs
What is resource utilization?
Resource utilization is the percentage of available working time spent on productive or billable work. It shows how effectively a team converts capacity into output and revenue. In professional services, it helps leaders understand whether resources are fully used, underutilized, or overworked, and whether capacity is aligned with demand.
What is the formula for resource utilization?
The typical resource utilization formula is calculated by dividing billable hours by available hours and multiplying by 100. This gives the percentage of time spent on revenue-generating work. It is a simple calculation, but its accuracy depends on consistent time tracking and clearly defined working capacity across the team.
What is a good resource utilization rate?
A good resource utilization rate for most professional services teams typically falls between 70 and 85 percent. This range allows teams to maximize revenue while maintaining sustainable workloads. Going beyond this range can lead to burnout and quality issues, while lower utilization indicates unused capacity and missed revenue opportunities.
How do you measure resource utilization?
You measure resource utilization by tracking total available hours and comparing them to actual billable or productive hours over a specific period. This requires accurate time tracking, consistent reporting, and a system that captures both planned and actual effort. The goal is to ensure the data reflects real work patterns.
What are the types of resource utilization?
Types of resource utilization include individual, team, role-based, project-level, and capacity utilization. Each type provides a different view of how resources are used across the organization. Together, they help identify imbalances, improve planning, and support better decisions around staffing, workload distribution, and growth.













Copyright © 2026 Rocketlane Corp. All rights reserved.



















.webp)